
Our Business
Business model

How we run our business
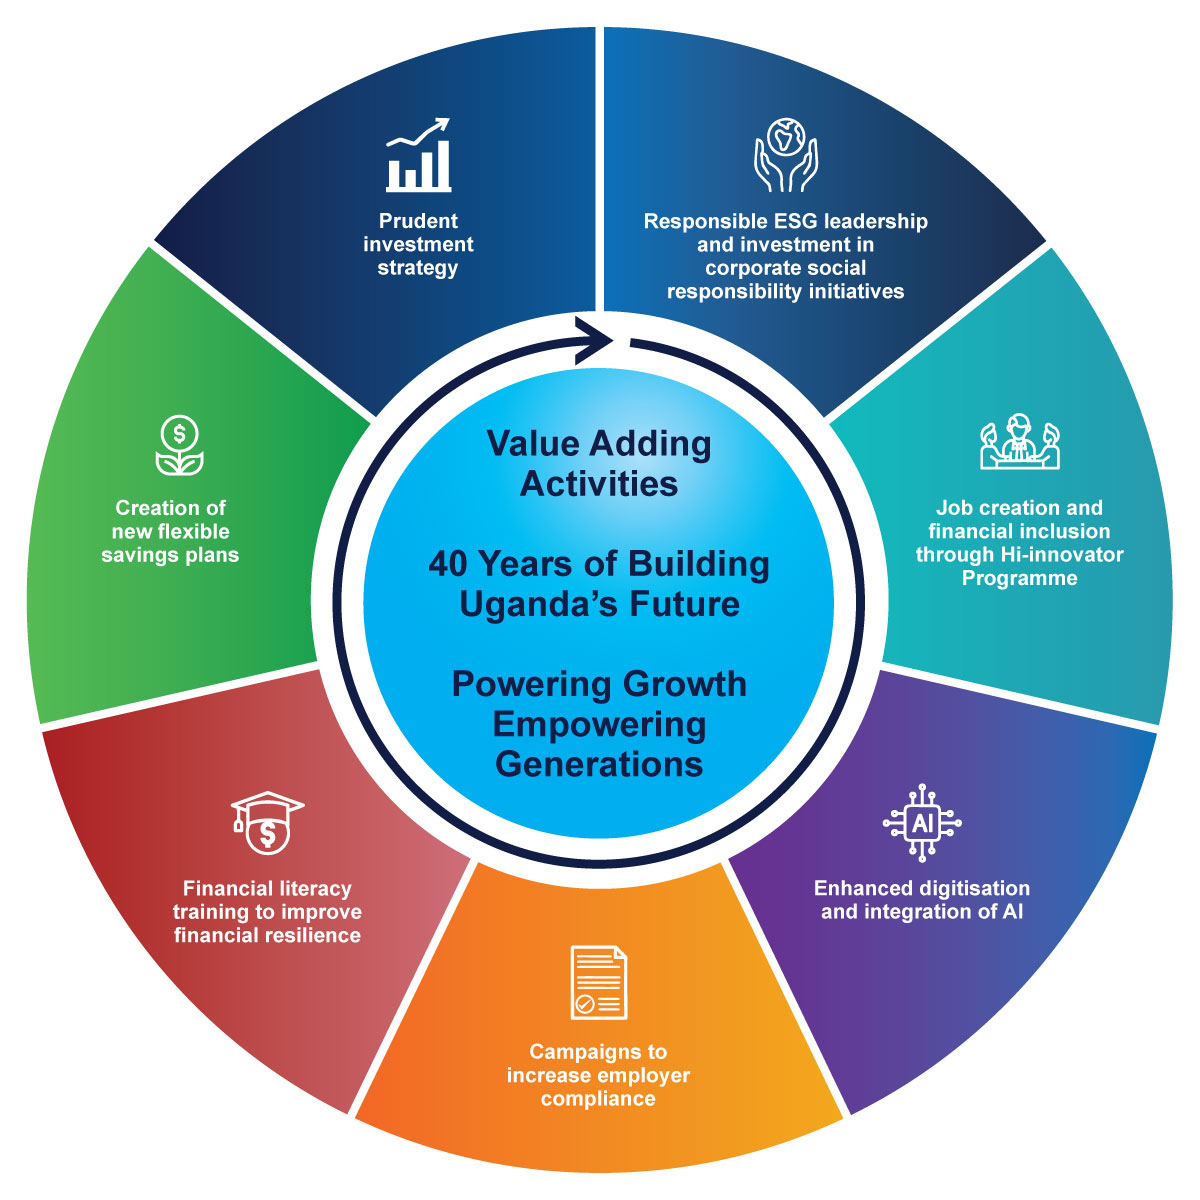
We create, preserve, and defend value by using our resources responsibly to generate value-maximising outputs and outcomes for our members and all stakeholders.
NSSF’s value creation model illustrates how we convert member contributions into long-term benefits by responsibly managing resources, driving innovation, and enabling national development.
Our activities are designed to grow member value while empowering generations through employment, financial security, and shared prosperity.
Inputs
- Member contributions and Employer contributions
Outputs
- Increasing the willingness and capacity to save
- Improved overall experience for our members
- Improved turnaround time for payment of member benefits
- Consistent delivery of a minimum return of 2% above inflation on member savings
- Faster time-to-market of new products
- Improved lives of members and communities in which we operate
- Members can grow their savings and afford a better life after retirement
- Improved financial resilience of our members
How our value-adding activities generate positive outputs and sustained value
Legend
Value creation
Value erosion
Value preservation
Key inputs
What we need to run our business
 Financial Capital
- Members’ Fund of UGX 25.55 Tn (June 2024: UGX 21.95Tn)
- Cash balance UGX 141Bn (June 2024: UGX 295.12Bn)
- Contributions received UGX 2.13Tn (June 2024: UGX 1.93Tn)
- Disciplined cost base supports investment: cost-to-income and administration ratios trending down
 Intellectual Capital
- A deliberately shaped, customer-centric culture
- A strong brand that resonates with consumers
- Brand costs of UGX 6.96Bn (June 2024: UGX 5.5Bn)
- Enterprise Architecture upgrades and digital platforms; benefit payment workflows; AI-enabled member service (chatbot)
 Human Capital
- 614 staff (June 2024: 605) skilled, customer-centric staff
- Staff satisfaction and engagement survey
- Significant investment in learning and development of UGX 2.43Bn (June 2024: UGX 3.25Bn)
- Employment Equity initiatives
- UGX 120.7Bn (June 2024: UGX114.5Bn) paid in salaries and benefits
- Employee wellness programmes. Investment of UGX 3.4Bn (June 2024: UGX 3.15Bn)
 Manufactured Capital
- Digital channel and innovation spend UGX 2.5 Bn (June 2024: UGX 2.32Bn)
- Infrastructure spend (branches and contact centres) UGX 13.6 Bn (June 2024: UGX 11.2Bn)
- Substantial investment in our Enterprise Architecture UGX 9.7 Bn (June 2024: UGX 4.6Bn)
 Social and Relationship Capital
- A focus on responsible procurement and supplier development
- Stakeholder engagement
- Focused and committed to corporate social investment
- Prioritising commitment to identified SDGs and responsible ESG practices
- Proactive employer compliance campaigns; financial literacy (UGX 0.31Bn); stakeholder engagement and CSI.
- BUBU sourcing at 97.1% local; supplier forums and mentorship
 Natural Capital
- Energy efficiency and management
- A meaningful contribution to our environmental sustainability, aligned to the national, regional and global development goals
- Water conservation and waste management
Key outcomes and trade-offs
What we achieve for our stakeholders
Financial Capital
- Cost-to-income ratio of 8.0% (June 2024 9.6%)
- Cost-of-Administration ratio of 0.89% (June 2024: 1.0%)
- Interest to members (RoE) of 13.5% (June 2024: 11.5%)
- Benefits paid UGX 1.32Tn (June 2024: UGX 1.12Tn)
- Benefits TAT 5.6 days (June 2024: 10.1 days)
- Employer compliance 52% (June 2024: 57%)
Trade-offs
- Increasing investment in East Africa
- Increasing investment in fixed deposits while reducing investment in treasury bonds
- Building more affordable houses for our stakeholders
Intellectual Capital
- Tonality score of 95% (June 2024: 92%)
- Customer satisfaction rate of 88% (June 2024: 87%)
- Retention of specialist skills (Data Science Specialists, Software Developers, and CFAs)
- Chatbot to efficiently deal with member queries on WhatsApp (As a result, increased e-channel to walk-in traffic ratio up to 96:4 from 91:9 ratio the previous FY)
- Benefit payment workflows to reduce turnaround time to payout benefits
- Brand equity and engagement; data and analytics capability maturing
- Reporting capability aligned to global frameworks (Integrated Reporting <IR> and Sustainability Reporting Frameworks (GRI, TCFD and IFRS S1/S2)
Trade-offs
- Digital convenience vs inclusion: keep assisted channels for vulnerable members as digital becomes default
Human Capital
Maintained employee motivation, skills and diversity through:
- Percentage salary increase for lower staff is equal to management for the same performance ratings
- Equity: 53.1% Male and 46.9% Female (June 2024: 53% Male and 47% Female)
- Employee attrition of 4% (June 2024: 3.4% )
Improved people satisfaction levels:
- 91% (June 2024: 89%)
- Benefits paid UGX 1.32Tn; benefits TAT 5.6 days; customer satisfaction 88%; tonality 95%
- Digital Index 86%; e-channel to walk-in 96:4; application uptime 98.18%
Trade-offs
- Tight budgets vs capability: protecting L&D and wellness in a low-cost environment sustains performance and service quality
- Service speed vs control: faster TAT requires tighter second-line checks to avoid rework
- Digital investment vs near-term opex: heavier capex/opex on IT reduces unit costs over time but lifts current spend
- Paperless drive vs legacy habits: paper use rose 116%; the fix is process discipline and e-GP adoption
Manufactured Capital
- 96% of our member transactions and interactions were hosted digitally (June 2024: 91%)
- Uptime of application systems at 98.18% (June 2024: 99.7%)
- Employees efficiently working from home: 100%
- 3.35 million customers (June 2024: 2.34 million)
- Digital Index 86% (FY 2024: 74%)
- Pay-out of benefits 5.6 days (2024: 10.1 days)
Trade-offs
- Digital first vs physical presence: branch spend remains to protect inclusion for non-digital members while migrating most services online
Social and Relationship Capital
- Responsible corporate citizen and commitment to SDGs
- UGX 242.40 Bn (June 2024: UGX 216.04Bn) direct and indirect tax contributions
- Buy Uganda Build Uganda (BUBU) (97.1% of procurements are with local suppliers) (June 2024: 98.8%)
- Local supplier contracts awarded UGX 25.58Bn (June 2024: UGX 24.4Bn)
- Financial literacy campaigns UGX 0.31 Bn (June 2024: 0.5Bn)
- New membership 9%: (June 2024: 8%)
- 93% of customers who logged complaints were resolved at the first attempt (June 2024: 94%)
- Launch of Smartlife Flexi, a new, voluntary goal-based savings plan
- 202,323 number of jobs created through the Hi-Innovator programme over 5 years
Trade-offs
- Local sourcing vs unit cost: prioritising local suppliers may raise near-term costs but strengthens the ecosystem and resilience
- ESG criteria vs supplier pool: higher standards may shrink options short-term but reduce risks long-term
- Local sourcing vs price: small cost premiums offset by national impact and supply chain resilience
- Process rigour vs speed: e-GP improves traceability; early market engagement manages lead times
Natural Capital
- 48.4% increase in water consumption (June 2024: increase of 27%)
- 38.6% increase in energy consumption (June 2024: increase of 123%)
- 116% increase in paper consumption (June 2024: 5% reduction)
- 100% of the waste from buildings diverted to KCCA pipelines in line with City Council Solid Waste Management Ordinance of 2000
- Green certificates for Pension Towers and the Lubowa housing project
The increases in energy, water, and paper consumption during the reporting period can be explained as follows:
- The 38.6% increase in energy consumption was due to an increase in occupancy rates mainly across the new properties i.e. Lubowa
- The 48.4% increase in water consumption was mainly attributed to leakages across the properties
- The 116% increase in paper consumption during the reporting period was primarily driven by a rise in member benefit claims and the additional documentation requirements associated with compliance audits
Trade-offs
- No Trade-offs
... and ensures our ability to create value in the future.